Search by keywords and gene IDs:
- CESA1
- AT4G32410
- Proline
Learn more about PlantConnectome and its novel utilities.
PlantConnectome offers three search options:
Search by keywords and gene IDs:
Finds and displays publications by author.
All search queries with hits return six results:

The number of abstracts and full-texts in the database containing the search query is shown for reference.
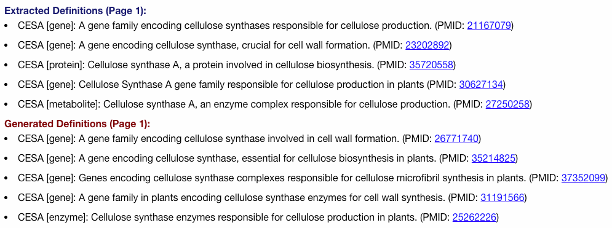
A collection of functions associated with the search query is displayed.
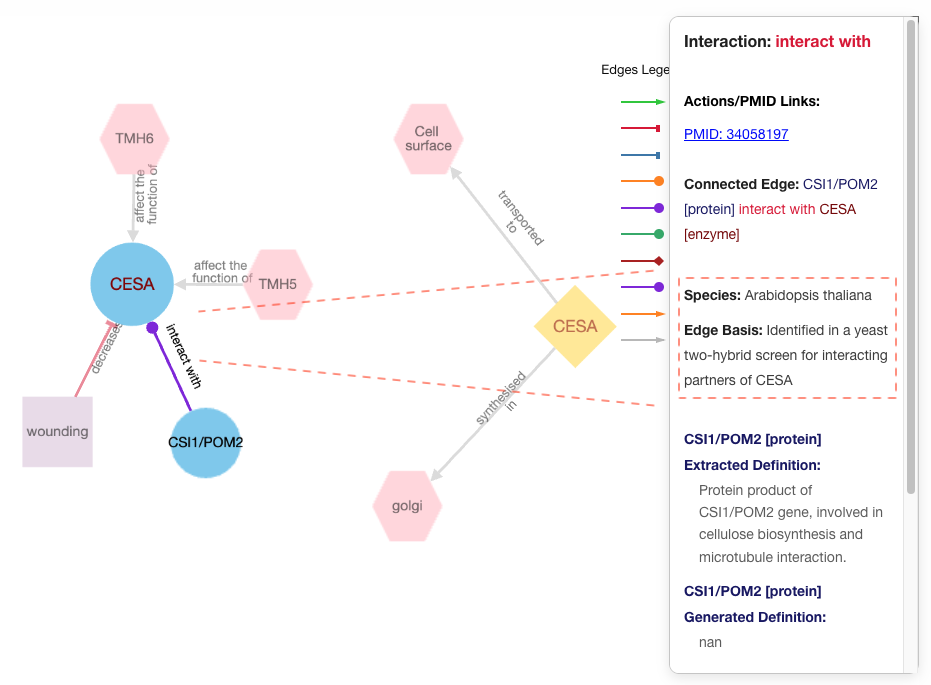
Upon clicking an edge, the experimental evidences and species for a particular relationship is displayed.
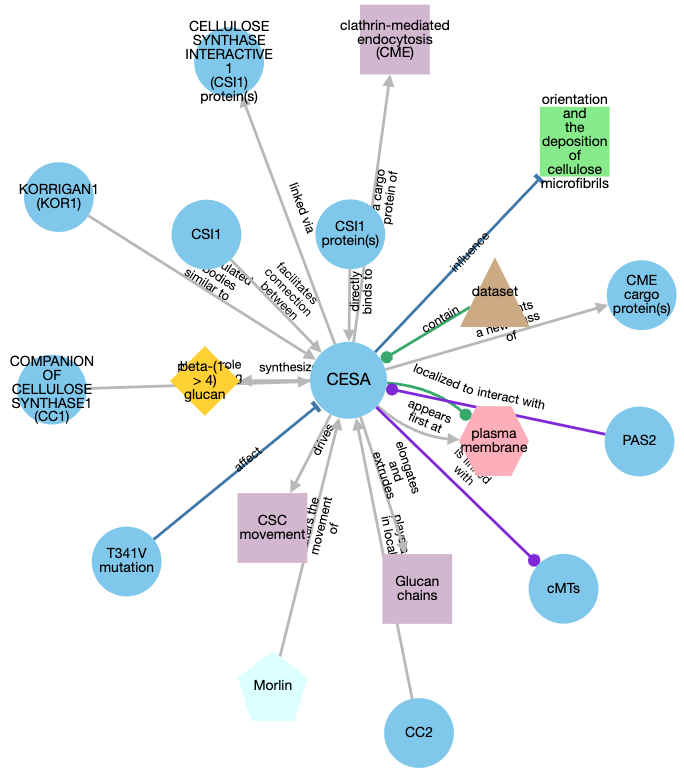
This directed graph summarizes the various entities in the database sharing relationships with the search query. Each node (i.e., colored shapes) and edge (i.e., colored arrows) on the graph represents an entity and a relationship shared between two entities, respectively. The colored shapes and colored arrows represents different entity types and relationship types.
This graph is also interactive; the user can alter its appearance via several options and filter the graph based on entity type and relationship type.
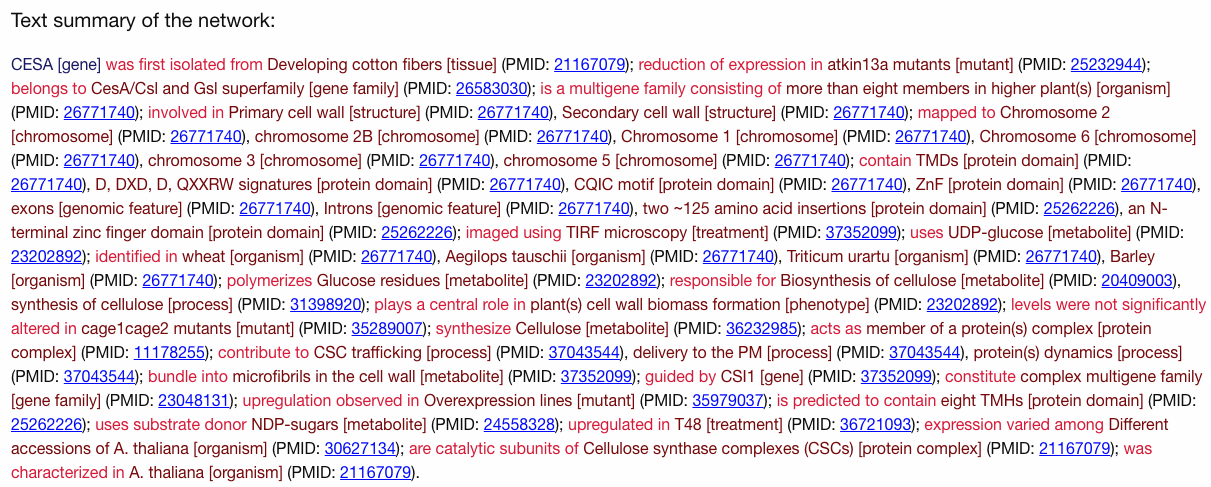
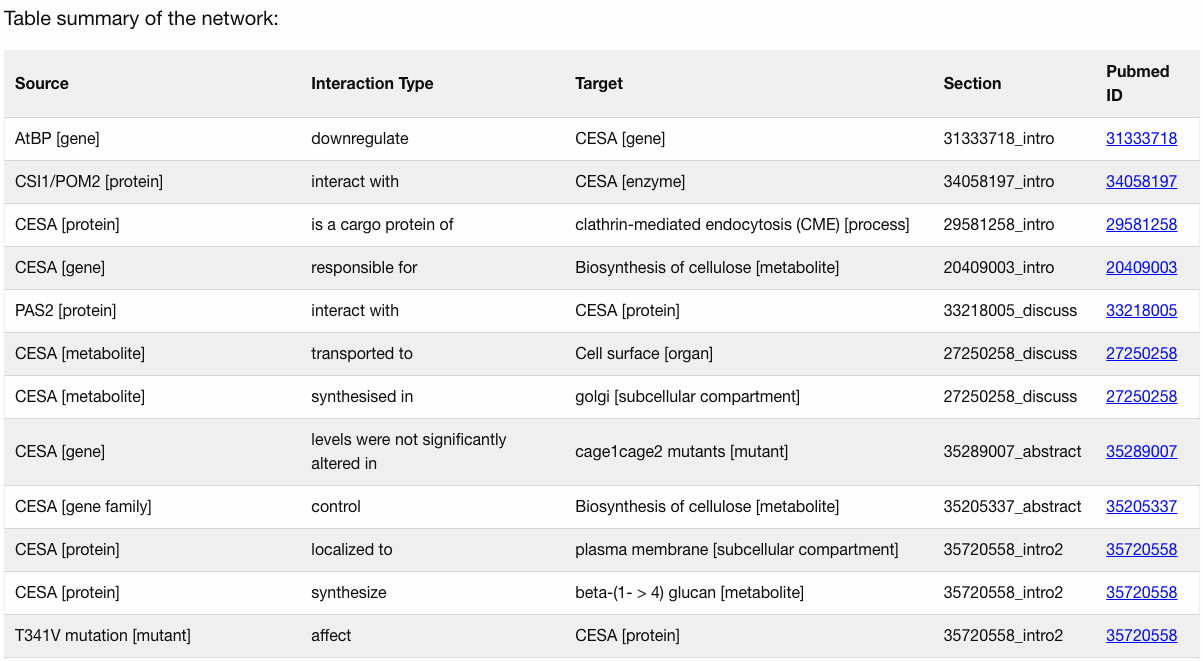
A text summary of the entity-relationship graph is shown for reference and the corresponding PMID for each relationship is stated. Text summary changes dynamically with visibility of the graph.
